What? No, watt

Before the advent of fluorescent tubes, halogen, metal halide, and light emitting diodes (LEDs), most people associated the brightness of a light source with the term ‘watt.’ In fact, all that metric describes is the amount of electricity used by a bulb per hour of operation. When most of us used incandescent bulbs, it was a safe bet a higher-wattage bulb would be brighter and as a result, some of us still associate the term watt with brightness. The reality is that for anything other than a standard incandescent bulb, we shouldn’t even be looking at the wattage of a light source except that it allows us to compare the cost per hour of operation. Before there were incandescent bulbs, there were candles and one of the earliest standardized measurements of brightness was the ‘foot-candle.’
Foot-candle is still sometimes used to describe the brightness of an illuminant or the general brightness on a surface or in a room. As implied by the name, it is defined as the amount of illumination on the inside surface of a sphere with a one-foot radius from a one-candela light source. When originally defined in the 19th century, the size and type of candle was carefully defined—and then promptly disagreed upon. The term has somewhat fallen out of favour and been supplanted by ‘lumen’ and ‘candela,’ the latter of which is the theoretical brightness of one candle viewed from one foot away. A millicandela is, as the prefix would suggest, one-thousandths of a candela and it’s not unusual for the brightness of a light emitting diode (LED) to be expressed in millicandelas, abbreviated as ‘mcd.’ A lumen can be thought of as a measure of the amount of visible light energy in a specifically defined beam or angle. Since a lumen considers only that part of the spectrum visible to humans, it can provide useful, though, somewhat incomplete information. For instance, the amount of ultraviolet produced by a light source is not measured in lumens; knowing the lumen output offers no indication of how accurately it renders colours.

Colour Rendering Index (CRI) is one of the metrics CIE created as a means of comparing the ability of an illuminant to render a specific group of 10 standardized colours compared to an ideal light source. A CRI of 100 would be a perfect match to the reference illuminant. CRI is only meaningful when comparing similar types of light sources.
For instance, a fluorescent lamp with a CRI of 90 renders colour better than a fluorescent lamp with a CRI of 80; however, it doesn’t indicate whether or not it renders colour better than an LED with a CRI of 85. In addition, for CRI comparisons to be meaningful, the illuminants need to have the same Correlated Colour Temperature (CCT) when the CCT is less than 5000K.
If an illuminant has a CCT of 5000K or higher, the comparison is based on one of the CIE ‘D’ standard illuminants that represent an idealized daylight environment. CIE D50 represents morning horizon daylight, CIE D55 represents mid-morning daylight, CIE D65 represents average noon north daylight, and CIE D75 represents north daylight. CCT is a measurement of the apparent colour of the light source and is expressed in degrees Kelvin. Based on a theoretical ‘radiating blackbody,’ the idea is much like the appearance of a torch flame; as it gets ‘hotter,’ the colour changes from yellowish to blue. This gives rise to the idea of a ‘warm light’ or a ‘cool light.’ For most of our applications, lighting at or above CCT 5500K is most useful; the lighting typically used for colour grading diamonds is in the range of CCT 6400K to CCT 6700K. However, correlated colour temperature and colour rendering index still aren’t the whole story.

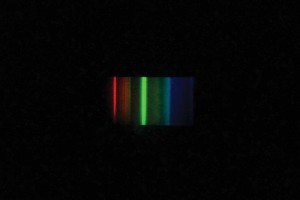
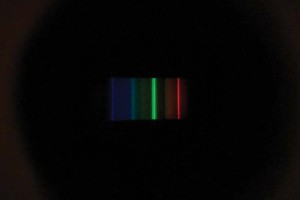
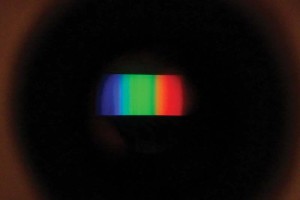
In order for an object to accurately reflect a colour, it must be present in the spectrum of the light source. This gives rise to the concept of Spectral Power Distribution (SPD). As the name suggests, SPD measures the relative strength of the various wavelengths in a light source. In general, since incandescent lights are, in effect, blackbody radiators, they contain the full spectrum and typically exhibit a relatively continuous SPD, although stronger in red, orange, and yellow. That may be why an incandescent light is considered to be the preferred lighting environment for grading opals. It’s in this area that fluorescent lighting falls short as the phosphors tend to have distinct ‘spikes,’ rather than the preferred continuous SPD curve. However, as we know from living with incandescent lighting, having a complete spectrum available doesn’t mean that colours are rendered accurately. One can use a handheld spectroscope to get a visual idea of a light’s SPD.


